How to Trade Cryptocurrency: Crypto Trading Basics
Disclaimer: The information on this website is for general information purposes only. It is not intended as legal, financial or investment advice and should not be construed or relied on as such. Before making any commitment of a legal or financial nature you should seek advice from a qualified and registered legal practitioner or financial or investment adviser. No material contained within this website should be construed or relied upon as providing recommendations in relation to any legal or financial product. Oxen does not recommend or endorse specific products and does not receive remuneration based upon investment or other decisions by website users.
We’re covered the basics of buying, storing and selling cryptocurrency. Now, it’s time to take things up a notch and take a look at cryptocurrency trading.
But before we get too deep, it’s important to note the difference between investing and trading.
Investing involves gradually building wealth over an extended time period — often years, through the buying and holding of assets. Investors will “ride out” downturns in the market, holding onto their investments with the expectation that prices will rebound and any losses will eventually be recovered. Investors typically are more concerned with market fundamentals, such as price/earnings ratios and management forecasts.
Trading involves frequent transactions such as the buying and selling of stocks, commodities, currencies, or other instruments like cryptocurrency. The goal of trading is to outperform ‘hodlers’ (buy-and-hold investors) by rapidly buying low and selling high, which (theoretically) allows you to take advantage of changes in the market which investors may miss out on because they hold their investments for longer periods of time.
A trader’s style is generally defined by the time frame (‘holding period’) in which they trade. Traders typically fall into one of the following four categories:
Position Trader, where trades are held for months or years
Swing Trader, where trades are held for days or weeks
Day Trader, where trades are held throughout the day, with no overnight positions
Scalp Trader, where trades are held for seconds to minutes
A number of variables — including investment capital, time, skill level, and personality — factor into determining the kind of trader someone becomes.
No matter what style of trading you favour, you need to be able to analyse assets and determine which assets to buy, and when to sell them. There are two primary methods for analysing cryptocurrency assets: fundamental analysis and technical analysis. These methods are often considered to be opposite approaches. We will start by looking at fundamental analysis, but the majority of this article will focus on technical analysis.
Basics of fundamental analysis (FA)
Fundamental analysis attempts to measure an asset’s intrinsic value by examining related economic and financial factors. When applying fundamental analysis to cryptocurrency trading, fundamental analysts typically study anything that could affect the value of the cryptocurrency and base their trading decisions on the following (among other factors):
Effectiveness of management
Strategic initiatives
Consumer behaviour
Current and forecasted state of the economy
Financial audits
Competitor analysis
A fundamental analyst will use this information to determine fair market value for a cryptocurrency and decide whether the current price of the cryptocurrency is above or below it. If the current price is above fair market value, they sell. If the current price is below, they buy.
Fundamental analysis is better suited for position traders (long-term).
Basics of technical analysis (TA)
Technical analysis was pioneered first introduced in the late 1800s by Charles Dow — sound familiar? Technical analysts believe that past trading activity (price and volume changes) of an asset can indicate future price movements.
Technical analysis involves tracking stock, commodity and currency chart patterns to discern price and volume trends, and use this information to identify buying or selling opportunities. Generally, technical analysis involves analysis of at least one of the following features:
Trend lines
Indicators
Patterns
Volume
Moving averages
Oscillators
Order book
Candlestick Patterns
Candlestick charts are a type of graph which visually represents price movements for an asset, such as a cryptocurrency. Believed to have been developed by Japanese market analysts in the late 1800s, candlestick charts are also known as Japanese candlestick charts.
Candlestick charts are used to identify trends so that traders can make informed trading decisions. These charts help you to identify a cryptocurrency’s opening and closing prices, highs and lows, and overall price range during a specific time period.
Anatomy of a Candlestick Chart

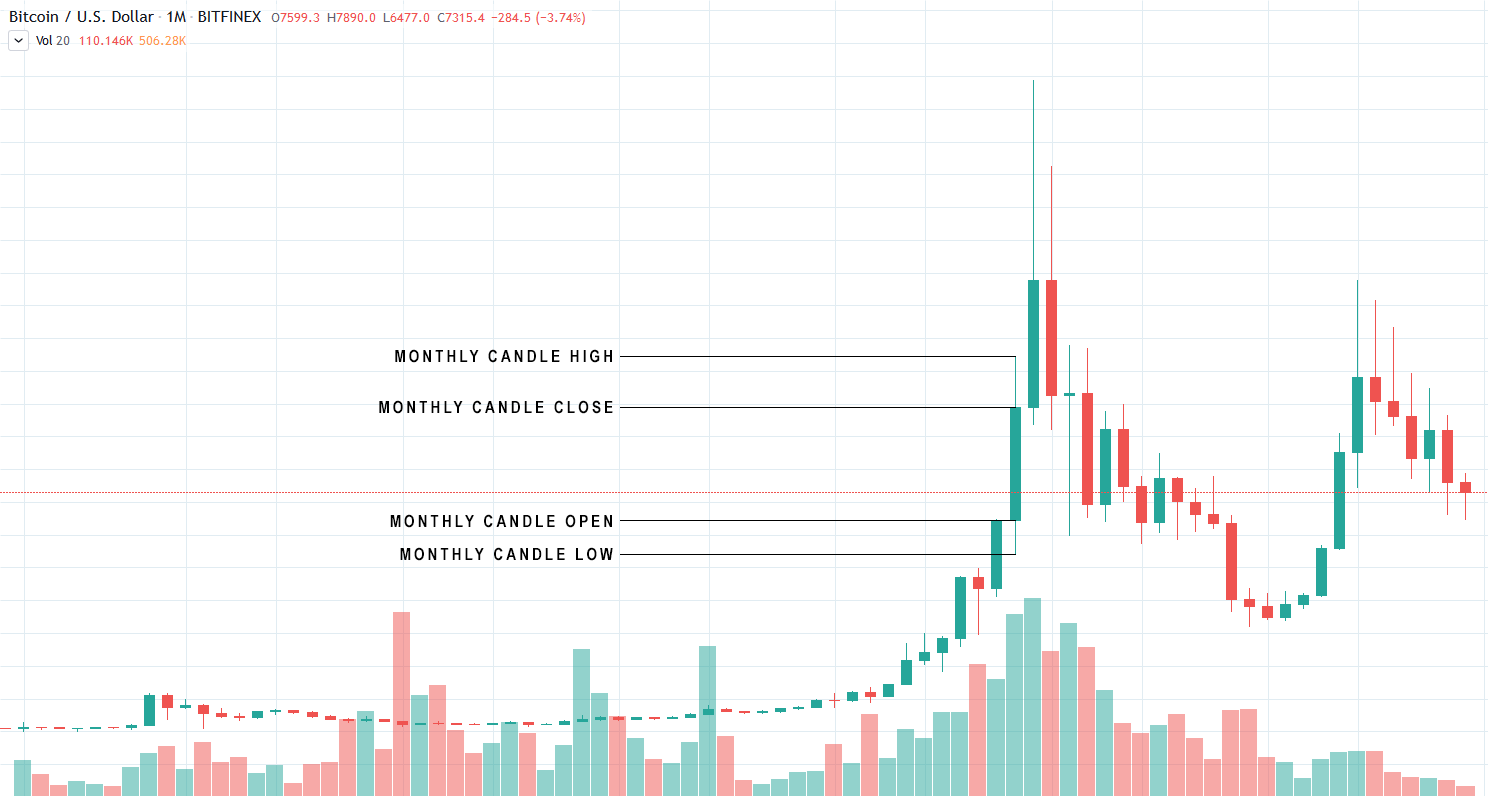
In the candlestick chart above, each candle (green or red bar) represents a period of one month.
Each candle can be broken up into three components: the body, the upper wick, and the lower wick.
The body of the candle shows the opening and closing prices of the cryptocurrency for a given period. In the chart above where each candle represents one month, a candle will show the opening price at the beginning of the month and the closing price at the end of the month. If the candle is green, the open price is the bottom of the candle body and the close price is the top of the candle body. A green candle means the price is increasing, i.e. the open price for that period was lower than the close price.
If the candle is red, the open price is the top of the candle body and the close price is the bottom of the candle body. A red candle indicates the price is decreasing, i.e. the close price for that period was lower than the open price.
Regardless of candle colour, the upper and lower wicks are the highest and the lowest prices reached during that month (between monthly open and close).
New candles generally open at the same level the previous candle closed.
Trend lines
Technical analysis hinges on the concept that price action follows a trend. Trend lines are typically diagonal (uptrend and downtrend) or horizontal (support and resistance).
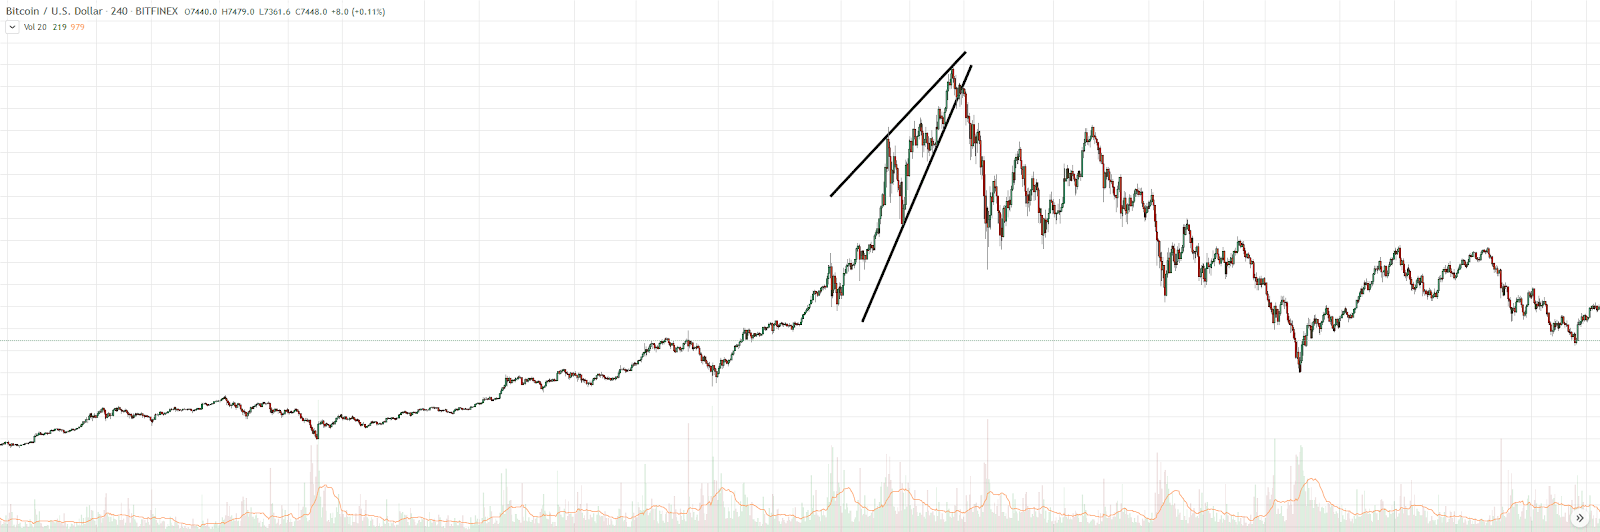
Uptrend

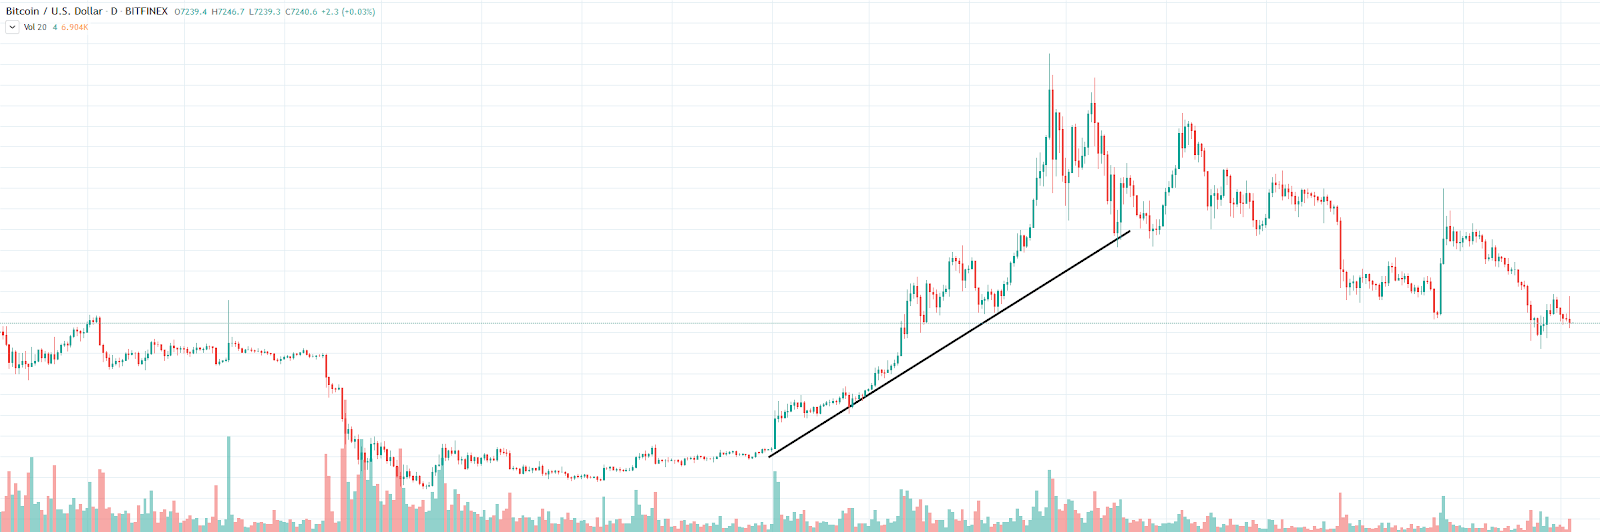
An uptrend on a cryptocurrency price graph such as the one above is a diagonal line that slopes upwards from left to right, indicating that the price is moving up. An uptrend is formed by connecting at least two low points on the price chart, with each low being higher than the previous. Generally an uptrend line which hits at least three low points would be considered validated. An uptrend indicates that buyers are more active than sellers, and this presumption holds true until the trend line is broken.
Downtrend
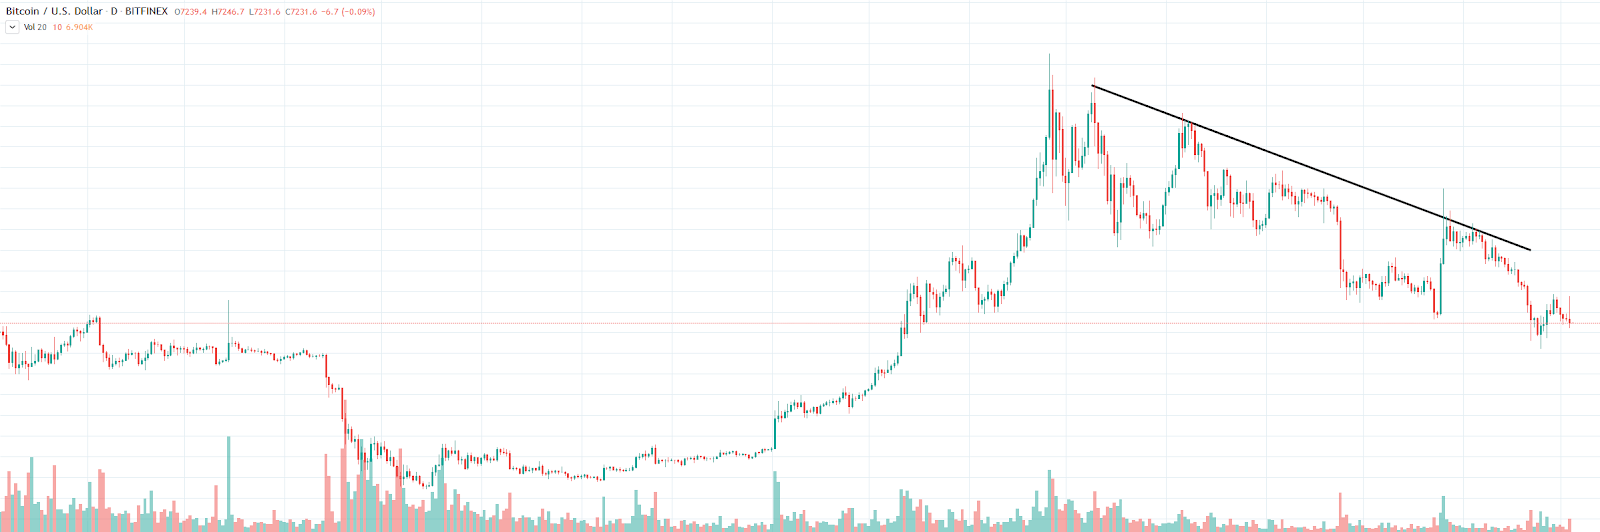
A downtrend is a diagonal line that slopes downwards from left to right, indicating that the price of the cryptocurrency is moving down. A downtrend is formed by connecting at least two high points on the price chart, with each high point being lower than the previous. Generally a downtrend line that hits at least three high points would be considered validated. A downtrend indicates that sellers are more active than buyers, and this presumption holds true until the trend line is broken.
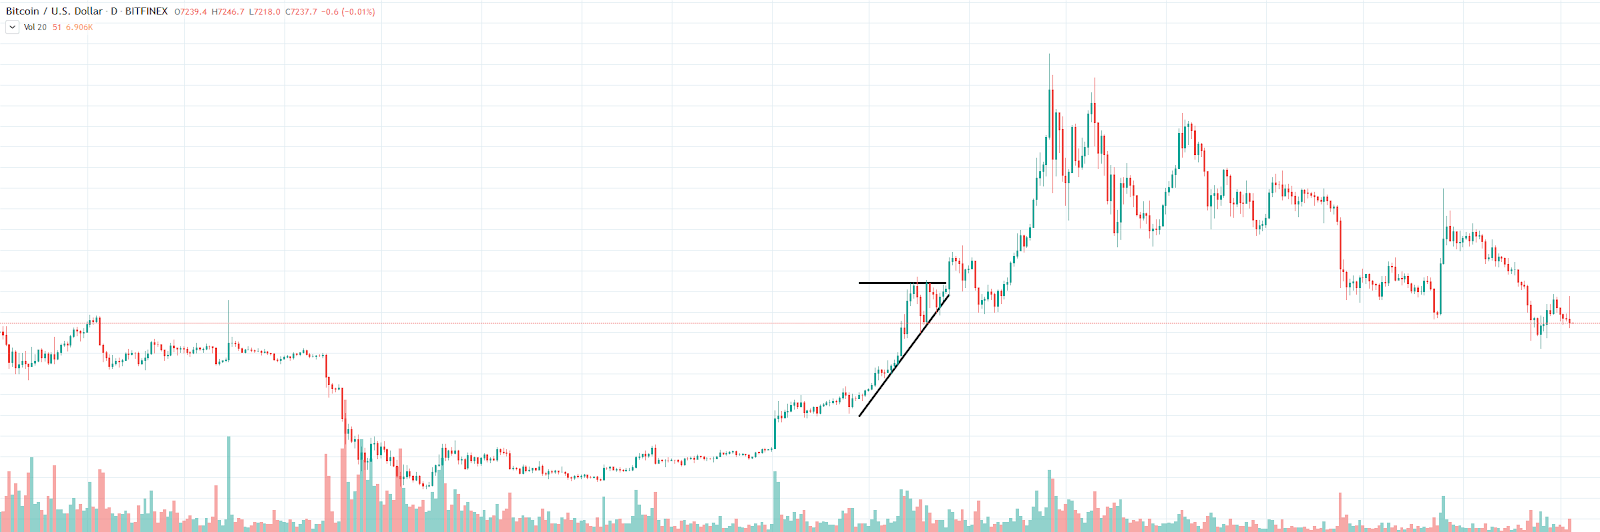
Support
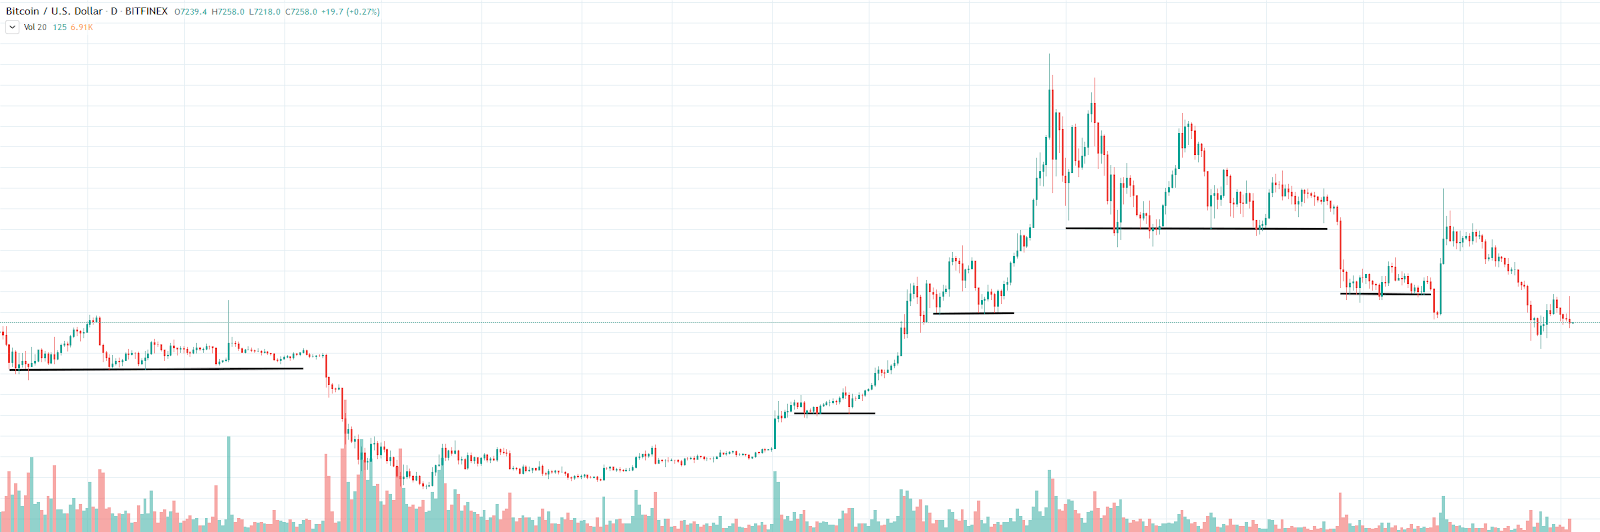
A support line indicates a price level where buyers believe market demand has the strength to prevent the cryptocurrency price slipping further. Similar to uptrend and downtrend lines, support levels can be identified by the price bouncing off the same low multiple times. Support levels are typically horizontal trend lines. Generally, the more the price bounces to the support level, the weaker the support will get; when support is weak enough, the price will lower below the support line.
Resistance
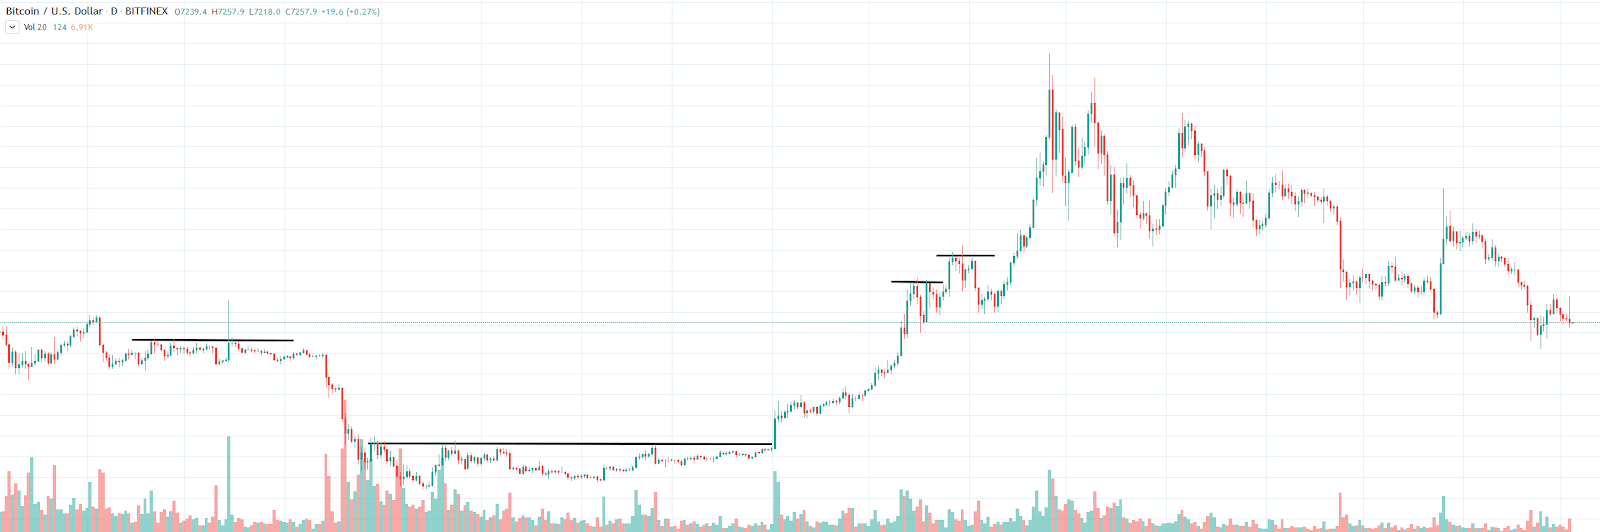
A resistance line indicates a price level where sellers believe there is not enough demand to push the price further up. Resistance levels can be identified by the price not pushing past a previous high. Resistance lines are typically horizontal trendlines, like support lines. Generally, the more the price pushes into resistance, the weaker the resistance will get.
Continuation patterns
Continuation patterns are highlighted by a candlestick setup that often leads to the continuation of a price trend. Continuation patterns include, but are not limited to:
Rising wedge
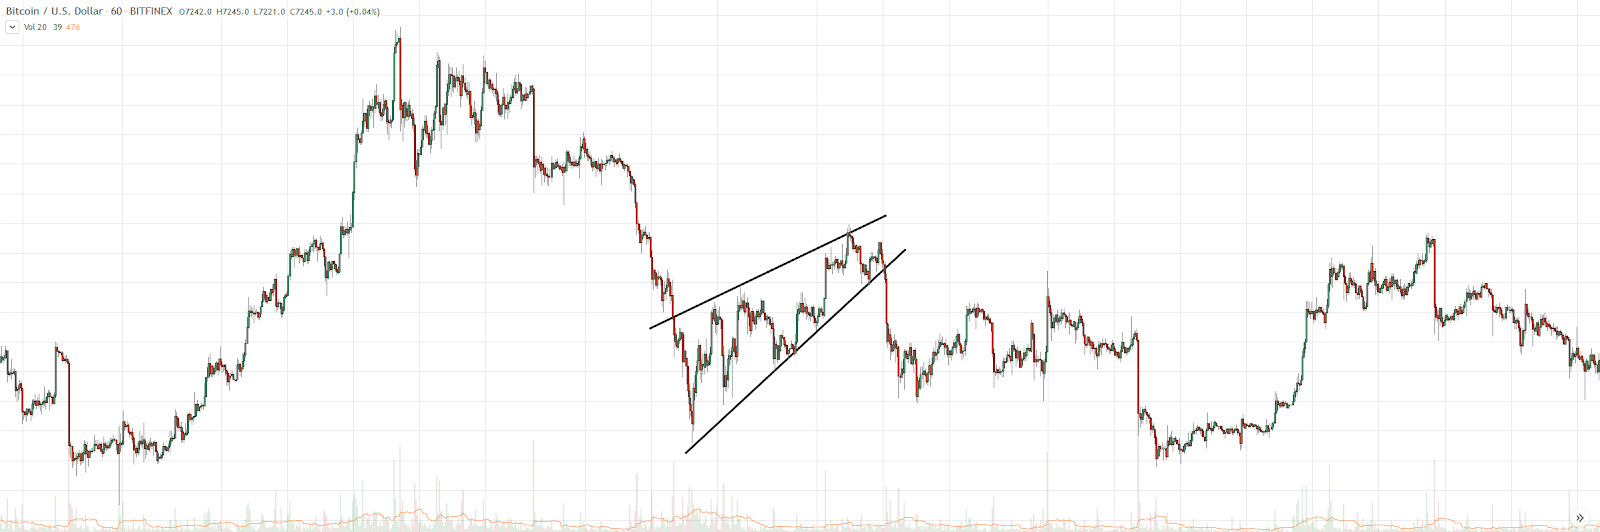
Wedge formations tend to follow three main rules: a convergence of trend lines, declining volume, and a break from trend lines. A rising wedge can appear during a downtrend when sellers begin to get exhausted, and selling volume drops correspondingly. This allows buyers to briefly take control, which forms a rising wedge. If buyers are unable to provide adequate volume to break upwards, the sellers can take control again and continue the downtrend.
Falling wedge
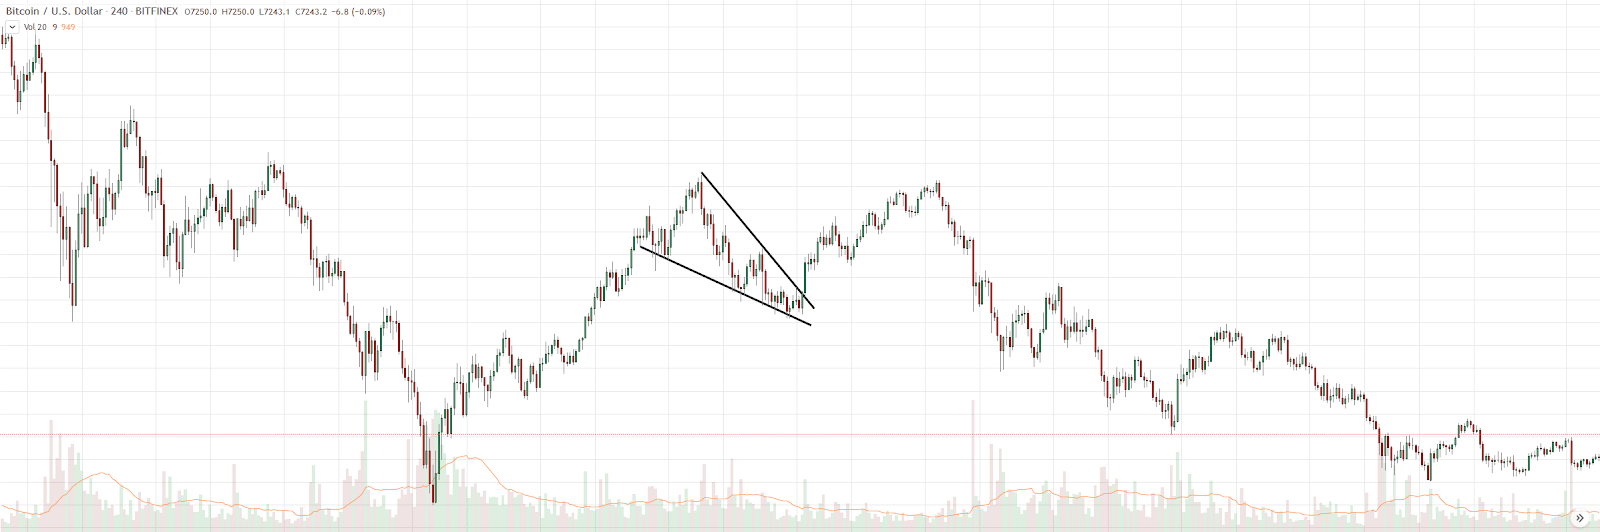
A falling wedge adheres to the same three rules as a rising wedge: trend line convergence, declining volume, and a breakout. A falling wedge can appear during an uptrend when buyers begin getting exhausted and there is a corresponding reduction in buy volume. This allows sellers to briefly take control, but if the sellers are unable to provide adequate volume to break down through the trend line, then buyers can retake control and continue the uptrend.
Bullish rectangle (Consolidation)
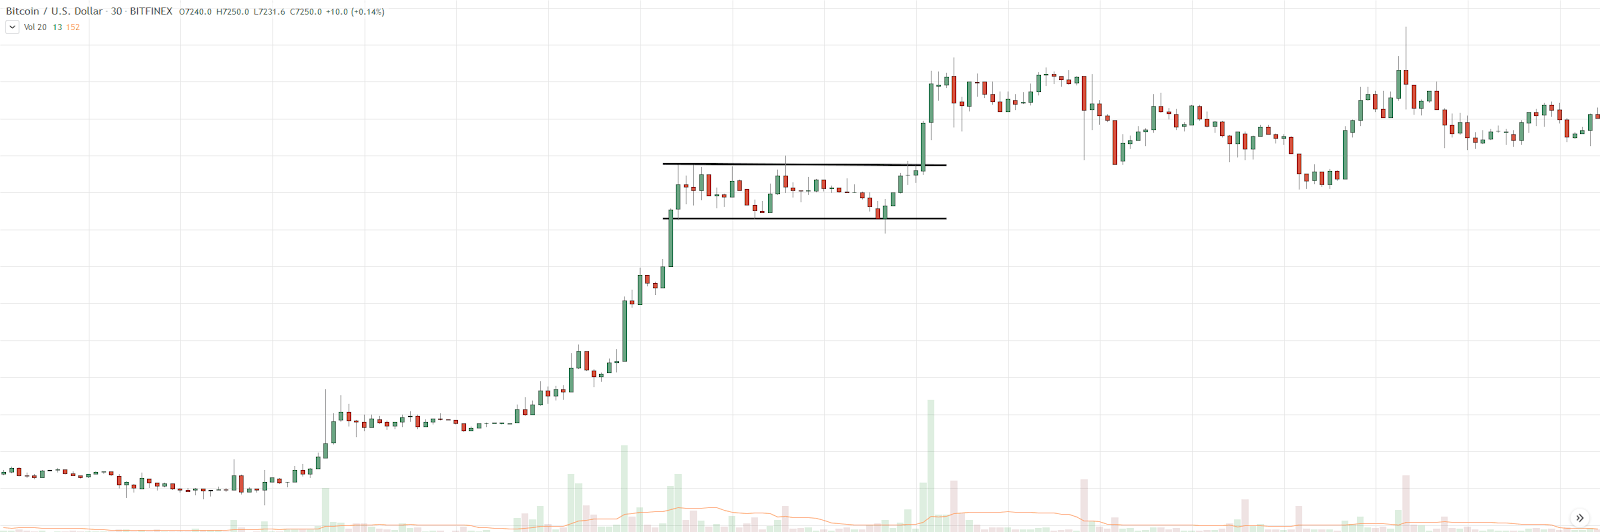
The bullish rectangle pattern is similar to the rising wedge pattern. A bullish rectangle marks a period where buyers are exhausted, but still hold the strength to keep sellers from taking control. After a consolidation period (sideways movement), the price may surge to a new local high.
Bearish rectangle (Consolidation)
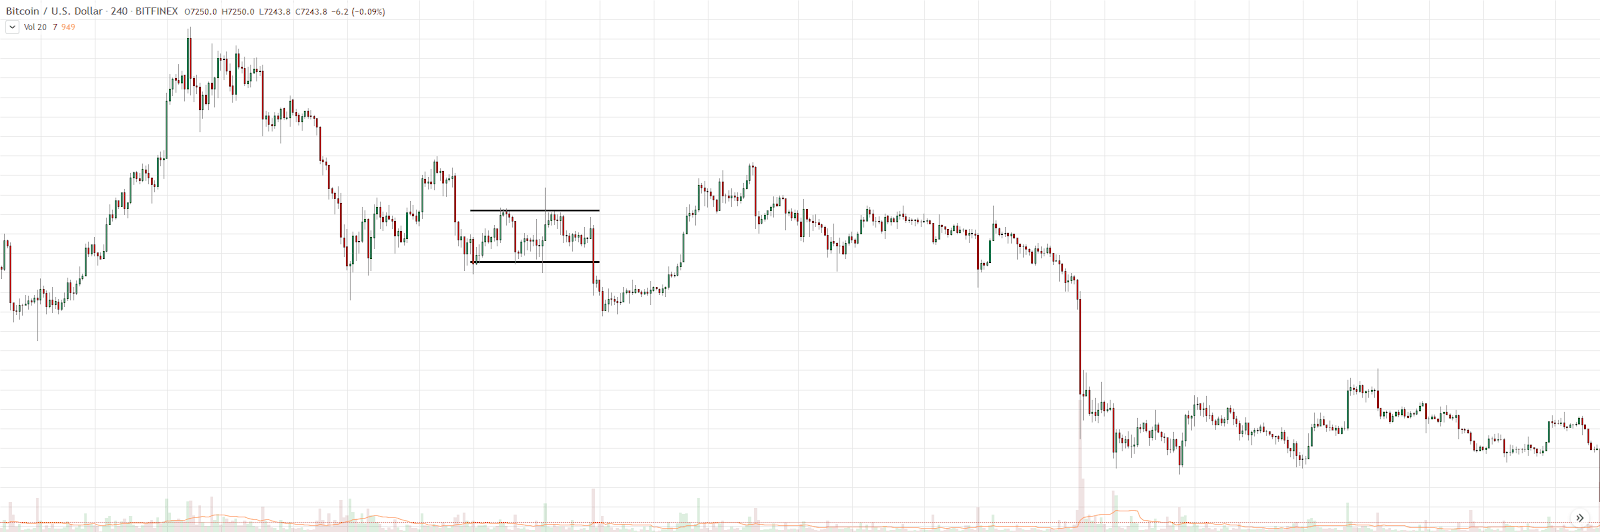
The bearish rectangle pattern is quite similar to the falling wedge pattern. A bearish rectangle marks a period where sellers are exhausted, but still hold the strength to keep buyers from taking control. After a consolidation period (sideways movement), the price may drop to a new local low.
Bullish pennant (Bull Flag)
A bullish pennant is a continuation pattern marked by the consolidation of two opposing trendlines (uptrend and downtrend). A bullish pennant marks a pause in an upwards-trending market.
Bearish pennant (Bear Flag)
A bearish pennant is similar to a bullish pennant, but marks a pause in a downwards-trending market.
Reversal patterns
Reversal patterns are characterised by a candlestick setup that often leads to a change in price trend. Reversal patterns include, but are not limited to:
Double top
The double top pattern is fairly self-explanatory. A double top forms when the price reaches a high, retraces (drops temporarily), and then has a second attempt at breaking through the resistance, but does not succeed. If a coin is bullish and rallies quite hard, a double top can soon become an ascending triangle that breaks upwards. A double top can also precede a price drop.
Double bottom
The double bottom pattern, like the double top, is fairly self-explanatory. A double bottom forms when the price reaches a low, retraces, and retouches the low. A double top won’t always precede a price rise; in fact, if a coin is bearish with little buy support, a double bottom can easily break down further.
Head & shoulders
The head and shoulders pattern is similar to the double top pattern, as it demonstrates a lack of buyer strength. With the head and shoulders pattern, the price reaches a high (the ‘left shoulder’), momentarily exceeds this high (the ‘head’), then is unable to continue trending upwards, falling to form the right shoulder.
Inverse H&S
The inverse head and shoulders pattern is the opposite of the head and shoulders pattern: instead of occuring around a high, it occurs around a low. The inverse head and shoulders pattern indicates a shift in power from sellers to buyers; the right shoulder indicates that sellers are unable to continue setting new lows.
Ascending wedge
An ascending wedge is similar to a rising wedge in appearance, with the main difference being that while a rising wedge forms during a downtrend, an ascending wedge forms during an uptrend. Generally, an ascending wedge prefaces a short-term price drop — if the cryptocurrency project behind the coin is strong, the coin may continue in its uptrend, but if the project is not so strong, the uptrend may reverse, becoming a downtrend.
Descending wedge

A descending wedge is similar to a falling wedge, with the main difference being that while a falling wedge forms during an uptrend, a descending wedge forms during a downtrend. Generally a descending wedge prefaces a short term price increase — if the cryptocurrency project behind the coin is strong, the downtrend may be reversed into an uptrend, but if the project is not so strong, the downtrend may continue.
Bilateral patterns
Bilateral patterns are patterns that have no structural bias. Generally a bullish cryptocurrency will break upwards from a bilateral pattern, and a bearish cryptocurrency will break downwards from a bilateral pattern. Bilateral patterns include, but are not limited to:
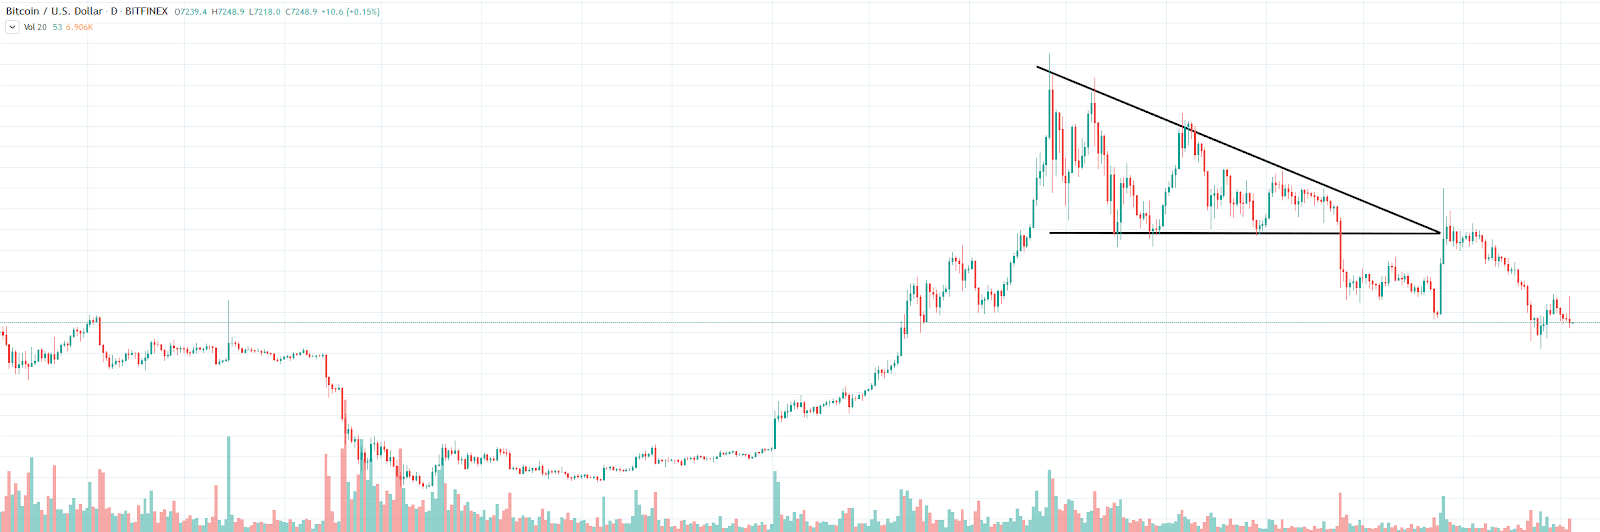
Ascending triangle
An ascending triangle is marked by an uptrend pushing into a horizontal resistance level. As the trend moves closer to the resistance level, the trend lines converge and the price must break up or down. In the case of a break downward, the formation may begin to resemble a double top.
Descending triangle
A descending triangle is marked by a downtrend pushing into a horizontal support level. As the trend moves closer to the support level, the trend lines converge and the price must break up or down. If the price continues downwards, the support level may become a resistance level.
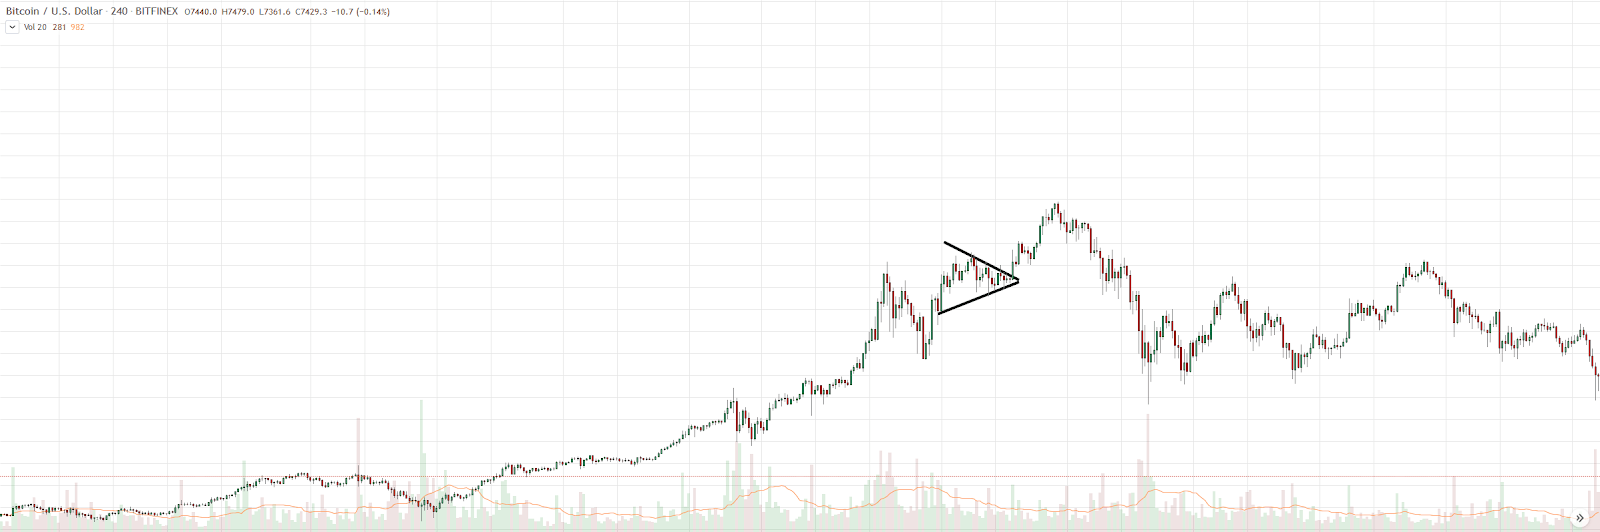
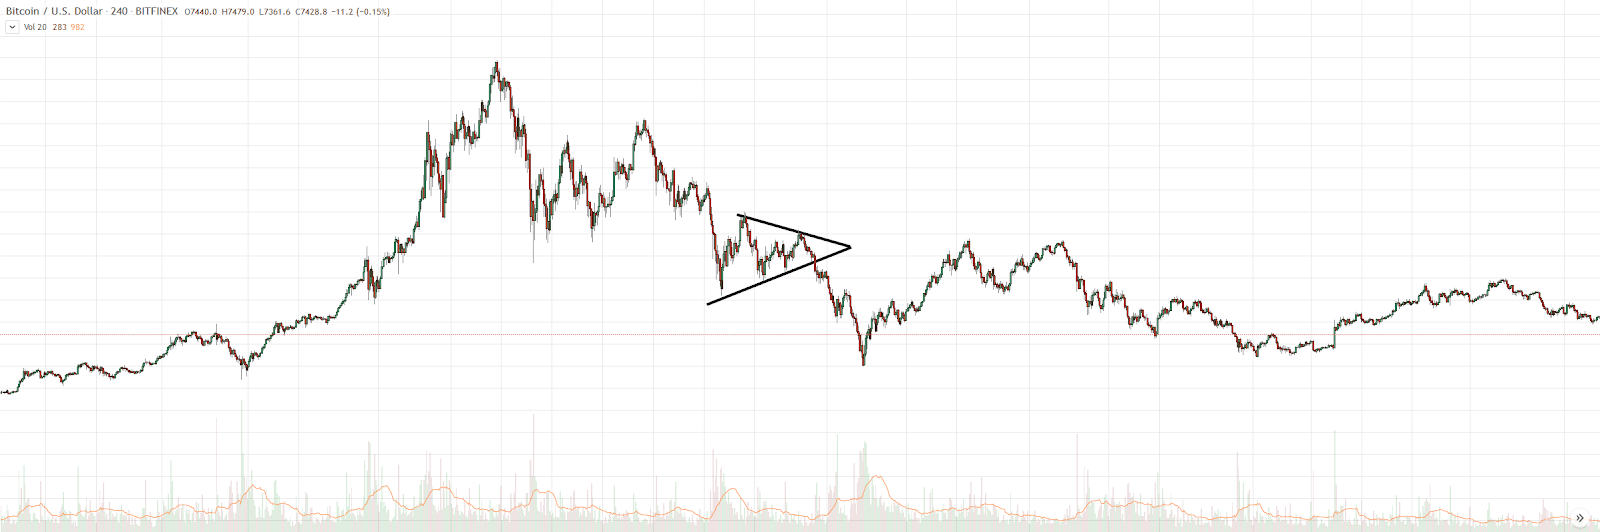
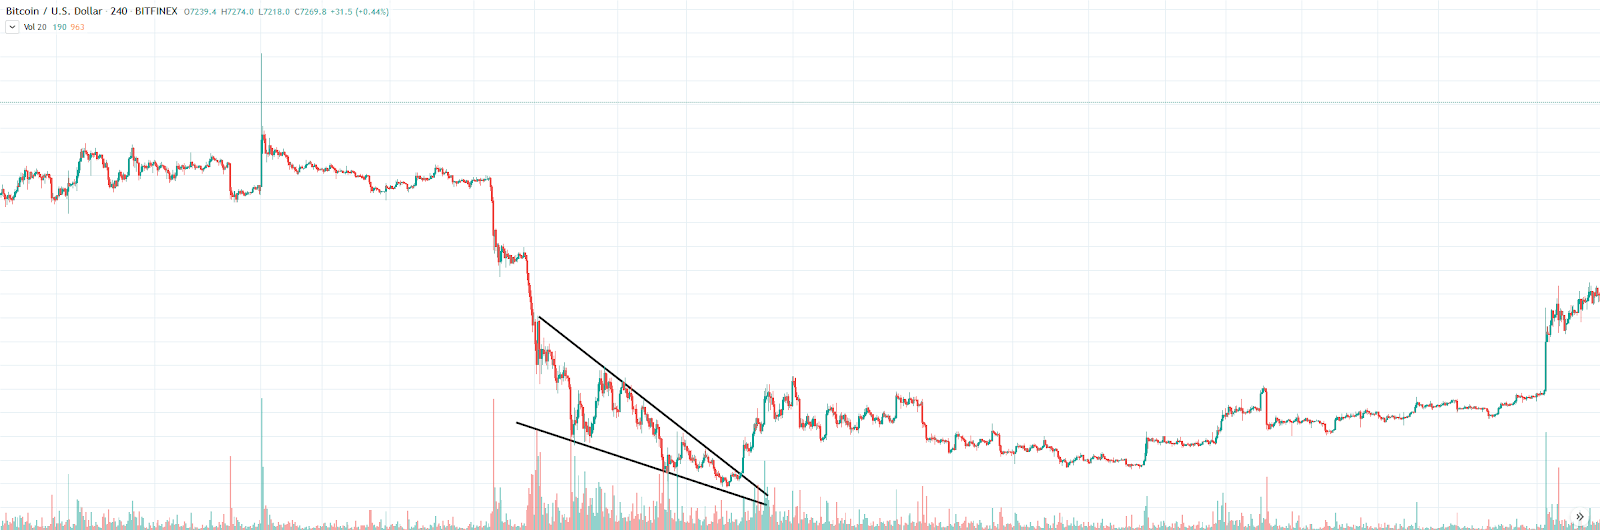
Symmetrical triangle
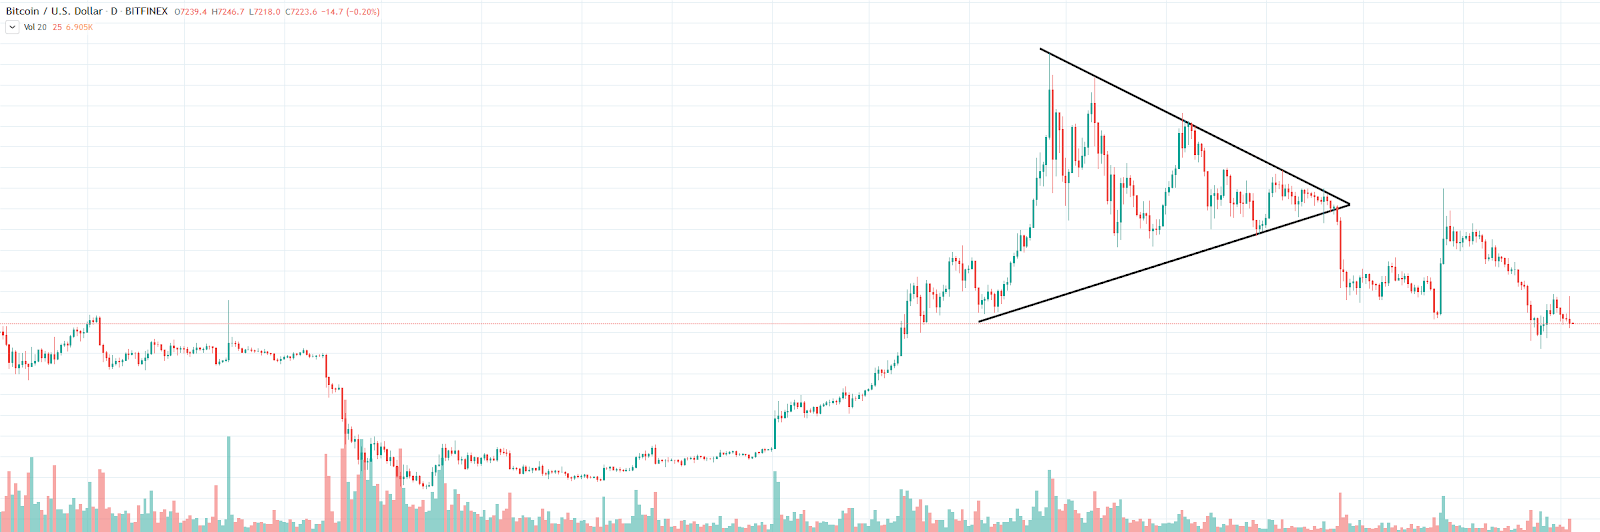
Symmetrical triangles are patterns that form between an uptrend line and a downtrend line with opposing gradients. Symmetrical triangles indicate an even balance between buyers and sellers. As the price moves horizontally towards the apex of the triangle, price volatility may see a temporary reduction. A significant move upwards or downwards is usually seen shortly after periods of low volatility, as seen in the above example.
Indicators
Bollinger Bands
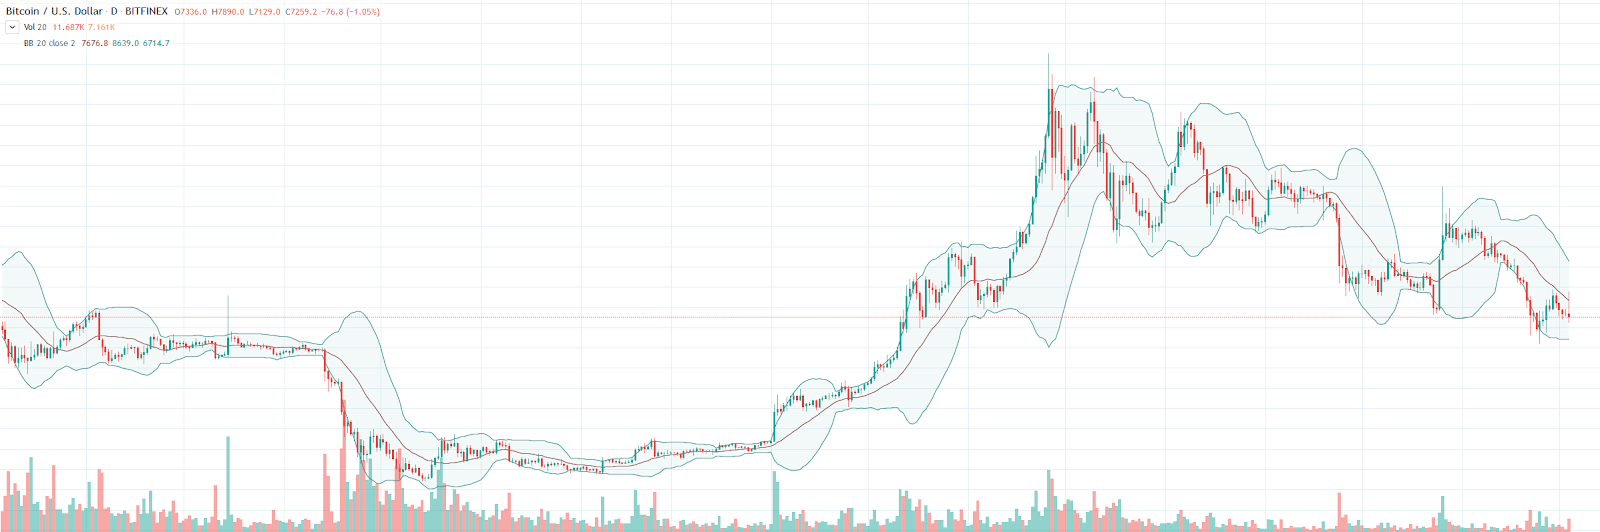
Bollinger Bands are a type of volatility indicator, useful for trading market ranges, consisting of two moving average lines, placed two standard deviations above and below the central moving average line. The appearance of Bollinger Bands is dependent on the current market state; thin bands mean the market is not very volatile, and wide bands indicate a volatile market.
Traders will often use the lower Bollinger Band as a support level, and the higher Bollinger Band as a resistance level — buying the bottom and selling the top. This variance is known as a Bollinger bounce.
Ichimoku cloud
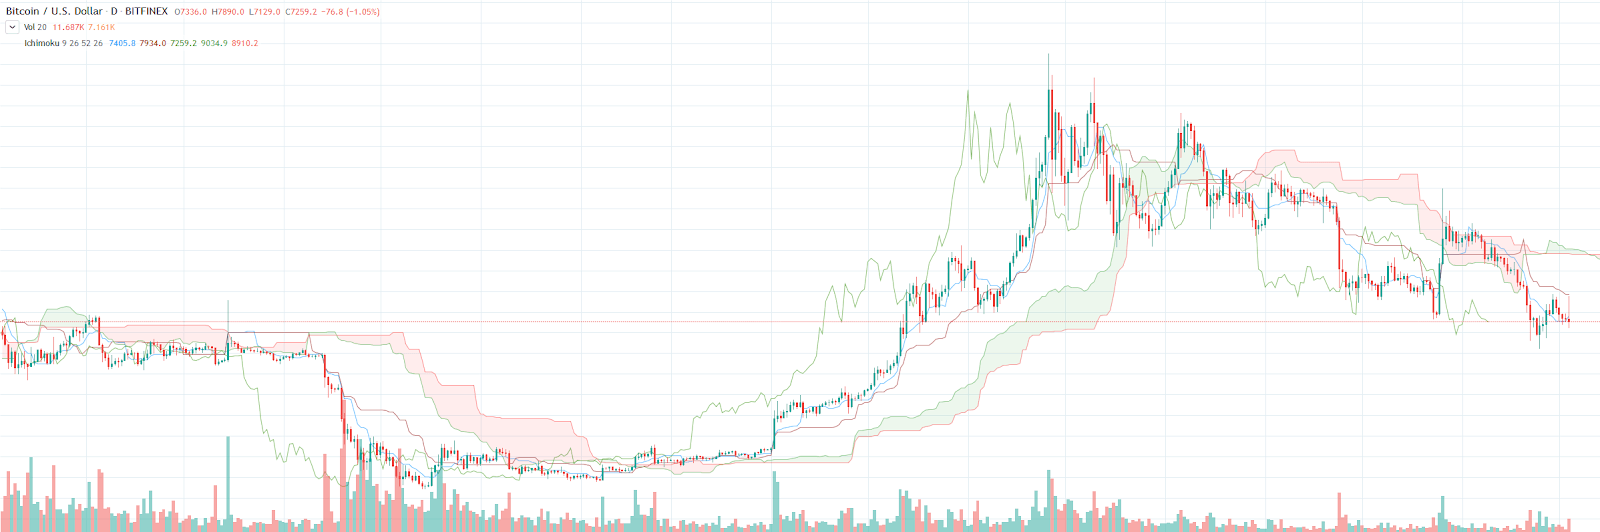
The Ichimoku cloud is a lagging indicator, meaning that it is based on previous price action. To keep things simple, we will focus only on the Senkou Span, which is composed of red and green bands/clouds that will hover over or under the current price, depending on how the cryptocurrency is trending.
If the price is below the red cloud, this generally indicates a downtrend. Traders often use the bottom edge of the red band as a resistance level that can flip to being a support level when the price breaks into the red cloud. As with Bollinger Bands, when the price is inside the Ichimoku cloud, traders can use the bottom side as a support level and the top side as a resistance level.
Price above the red cloud generally indicates a reversal in the trend. When this occurs, the red band will condense and change colour to green. Price above the green band generally indicates an uptrend.
Relative Strength Index (RSI)

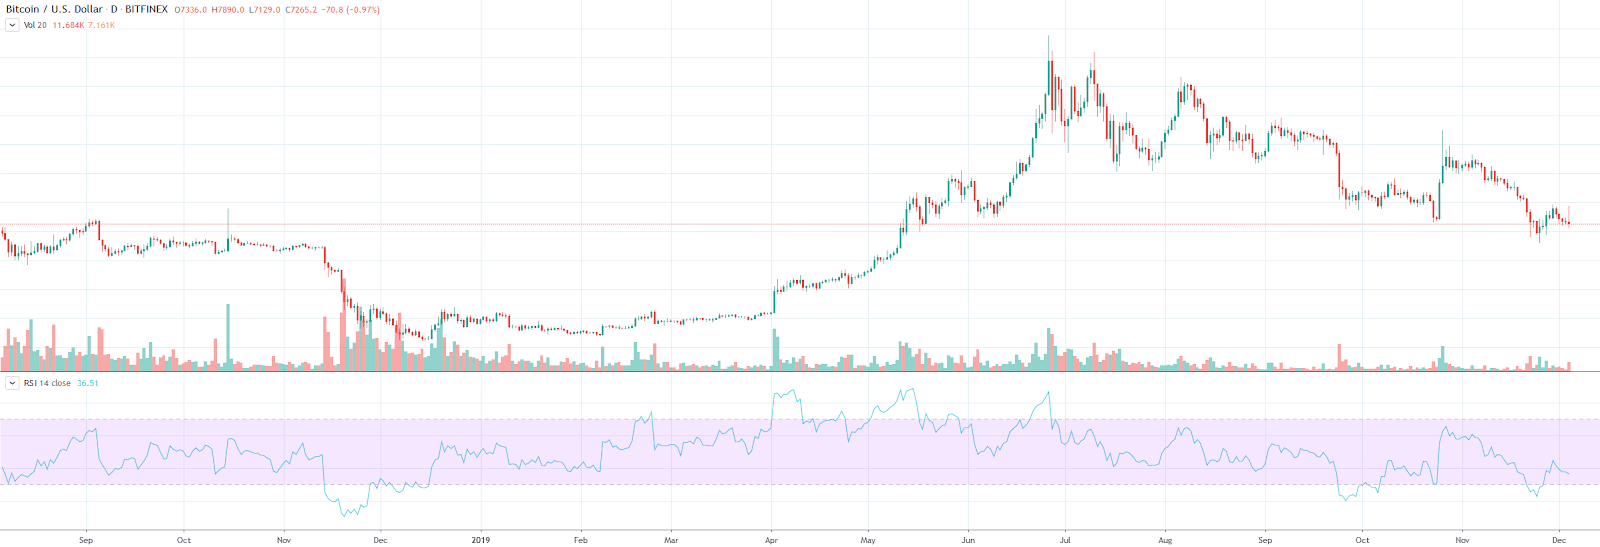
The Relative Strength Index (RSI) is a momentum indicator, useful for identifying a trend reversal (the top or bottom of a trend). RSI works on a scale of 1 to 100, with results between 1 and 30 indicating the cryptocurrency is oversold and results between 70 and 100 indicating the cryptocurrency is overbought.
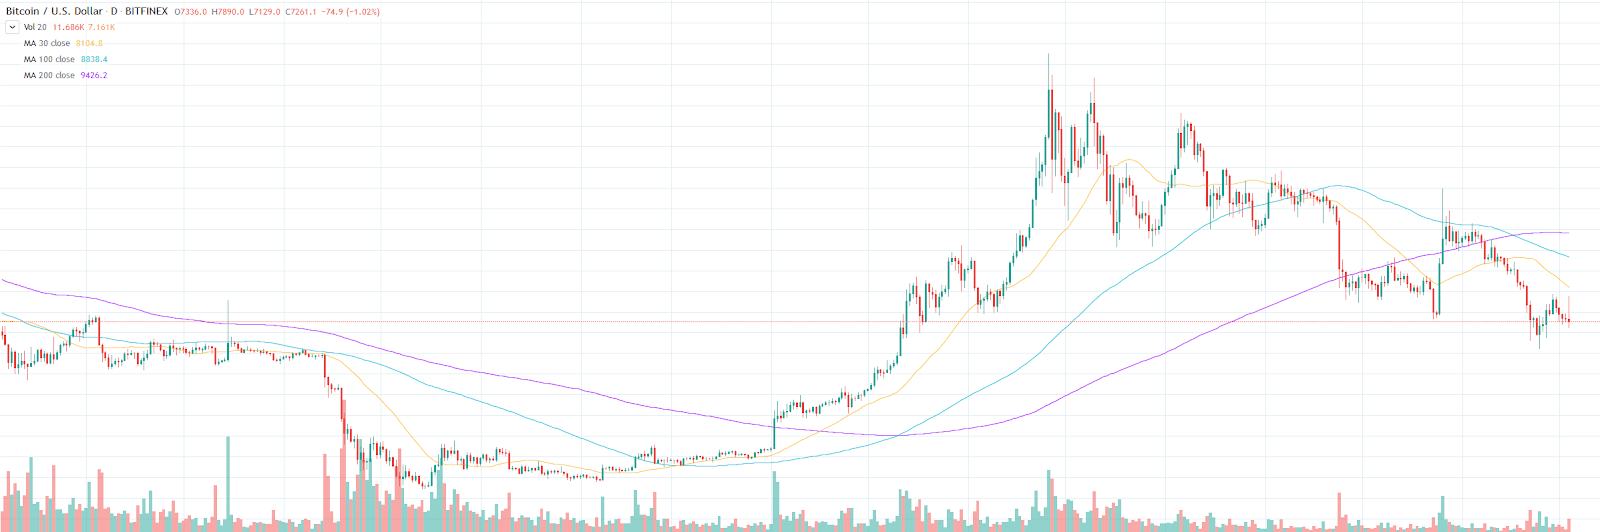
Moving Averages
Moving Average (SMA)
Moving Average (EMA)
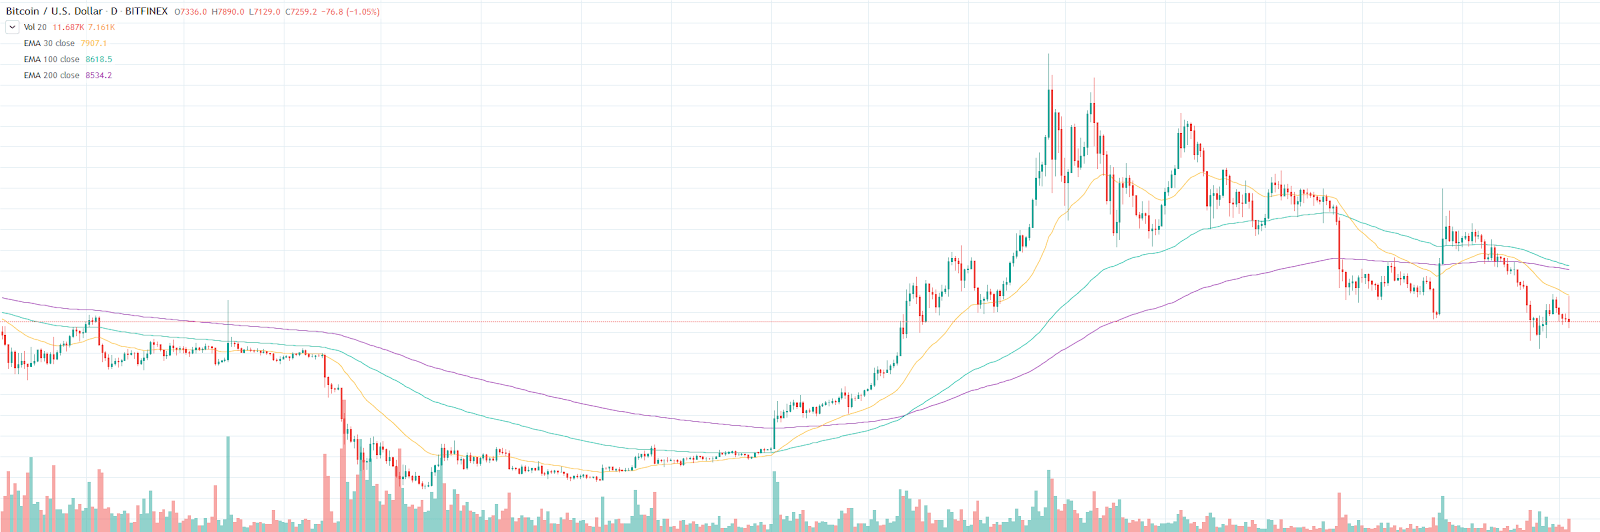
A Moving Average is an indicator that helps to smooth out volatile price action. The MA is a lagging indicator, which means it is based off past price activity. Moving Averages come in one of two categories: Simple Moving Average (SMA) and Exponential Moving Average (EMA).
The SMA takes the average price over a set period of time, often 30, 100 or 200 days. The EMA utilises a weighted average of those time periods, which means there is more weight placed on recent days, rather than taking an evenly-weighted average of all days within the span being analysed. This is why the moving average lines are closer to the current price in the EMA compared to the SMA.
Moving Average Convergence Divergence (MACD)
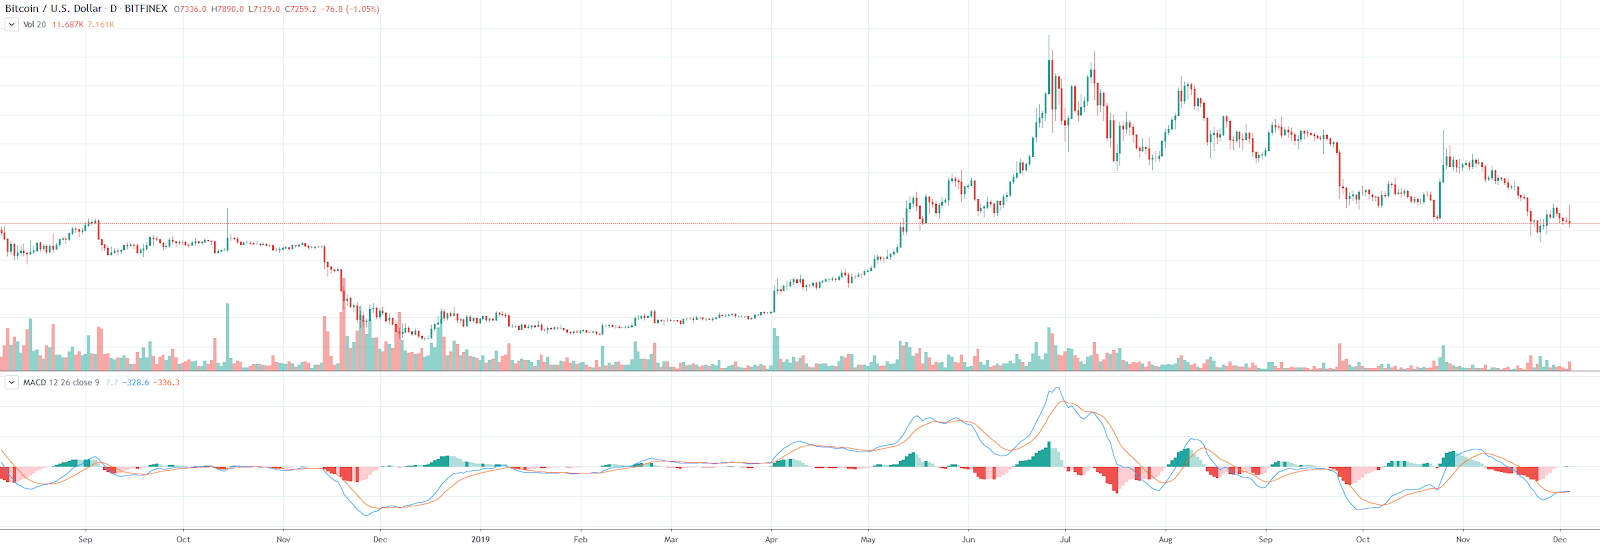
The Moving Average Convergence Divergence (MACD) can be somewhat confusing at first. The MACD is a combination of a fast-moving EMA (taken over a shorter period, such as 10 periods), a slow-moving EMA (from a longer period, perhaps 30 periods), and the difference between the two (displayed as a histogram). Generally, when a new trend is forming, the MACD lines will converge and eventually cross each other and begin to diverge, indicating a trend reversal. At the point of the MACD fast and slow lines crossing over, the histogram will show no value as the difference between the fast and slow MACD lines is zero.
Stochastic

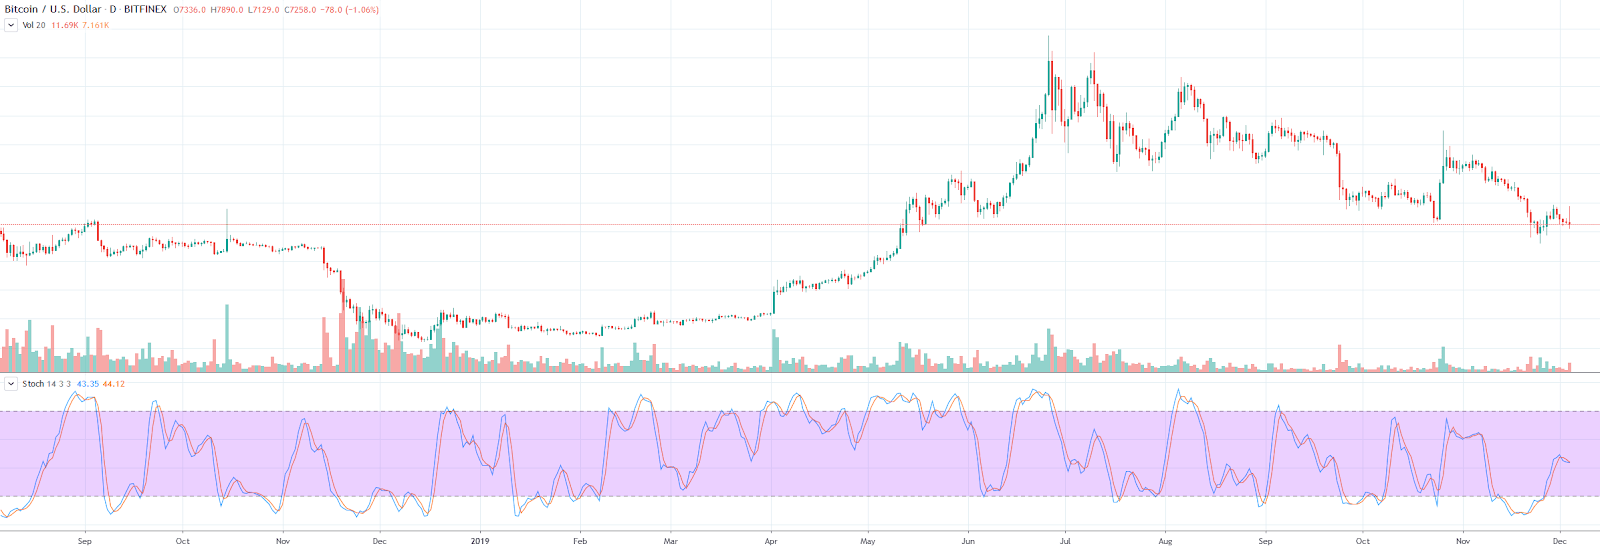
The stochastic indicator is a momentum indicator that can help you identify whether a cryptocurrency is overbought or oversold, similar to the Relative Strength Index. However, with the stochastic indicator, overbought levels are between 80 and 100, and oversold levels are between 0 and 20.
Volume
Volume is the measurement of how much of a particular cryptocurrency has been traded over a certain period of time, usually 24 hours — this includes how many times the cryptocurrency has been bought and sold over that time period. Higher trade volume generally means more liquidity for buyers and sellers to trade into, which results in less price slippage compared to a cryptocurrency with lower liquidity.
Order book

The order book is a visual and dynamic display that showcases a real-time list of orders placed by buyers and sellers on a cryptocurrency exchange platform.
The buy side of the order book shows all open limit buy orders that are below the current trading price. Where there are many orders at a specific price level, this is called a buy wall — identifiable by a steep stairway. Buy walls often act as support levels, but if selling pressure exceeds buying pressure, the buy wall will be eaten into and eventually the price will drop below that support level.
The sell side of the order book shows all open limit sell orders that are above the current trading price. Where there are many orders at a specific price level, this is called a sell wall — identifiable by a steep stairway. Sell walls often act as resistance levels, but if buying pressure exceeds selling pressure, the sell wall will be eaten into and eventually the price will rise above that resistance level.
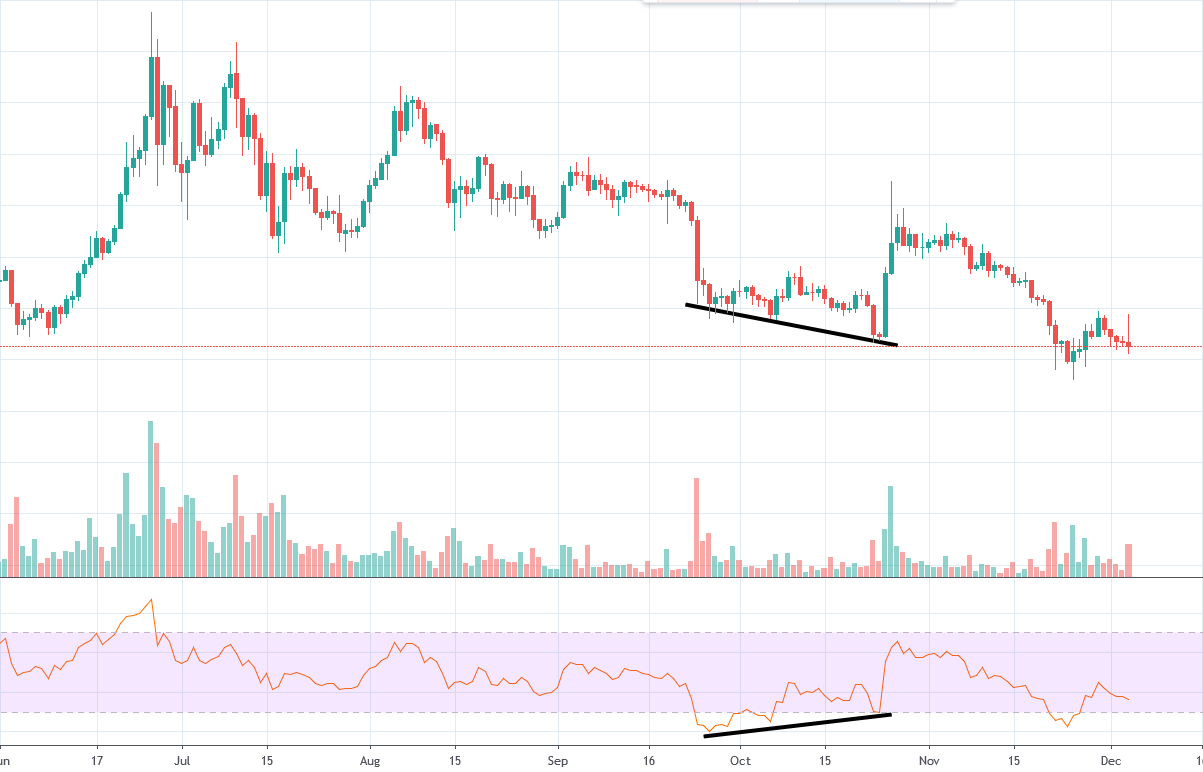
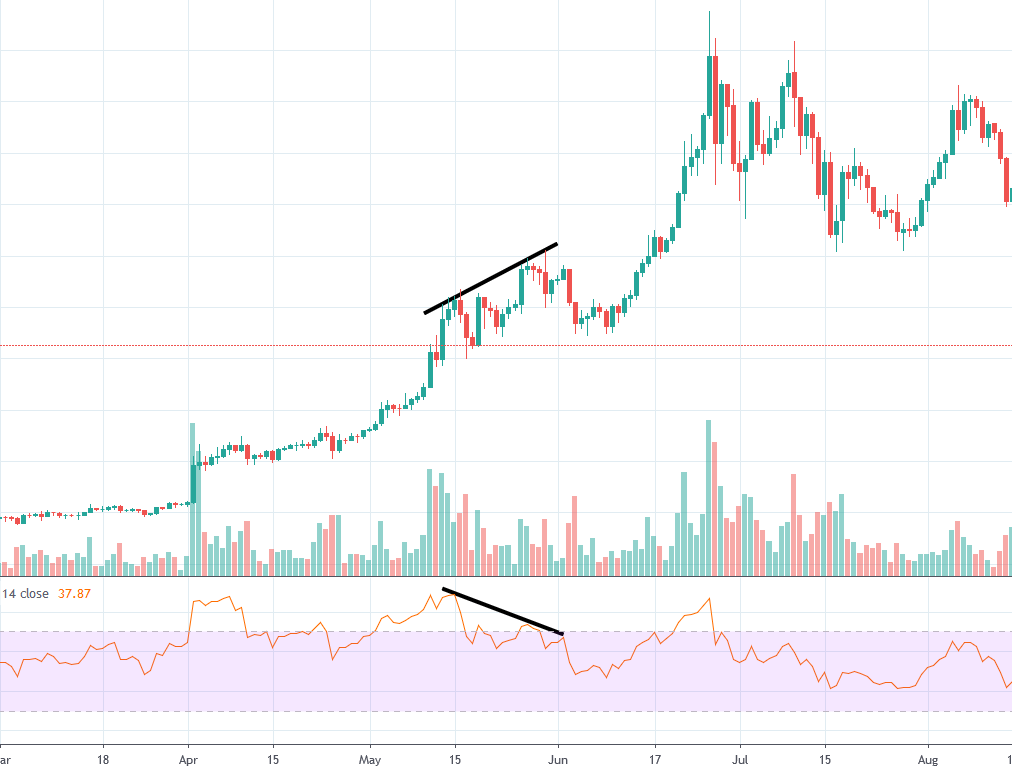
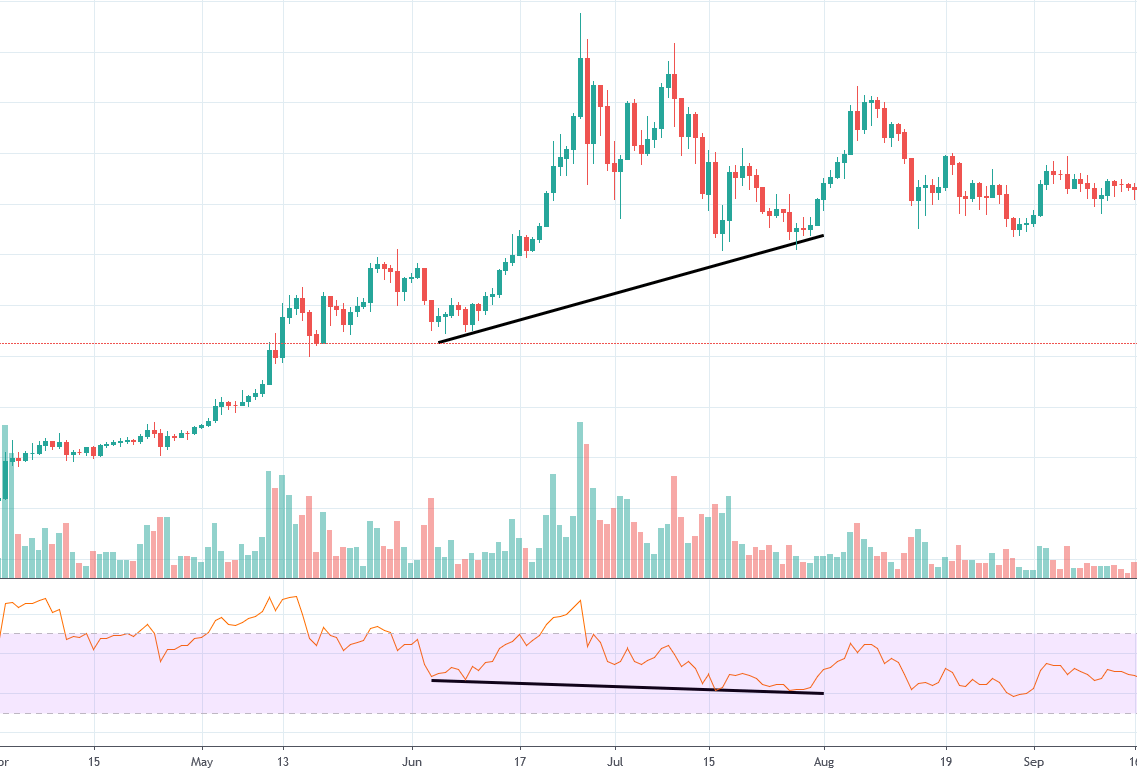
Divergences
A cryptocurrency divergence appears when price action follows a different path to that identified by an oscillator such as RSI or MACD. Classic bullish and bearish divergences may indicate a temporary change in trend or a full reversal, and hidden bullish and bearish divergences often indicate a continuation of the trend. As with other trends, validation is achieved after three touches of the trend line.
A good way to remember the difference between bullish and bearish divergences is that bullish divergence trend lines are placed below price and oscillator lows, whereas bearish divergence trend lines are placed above price and oscillator highs. For the examples below, the oscillator we have used is the Relative Strength Index (RSI).
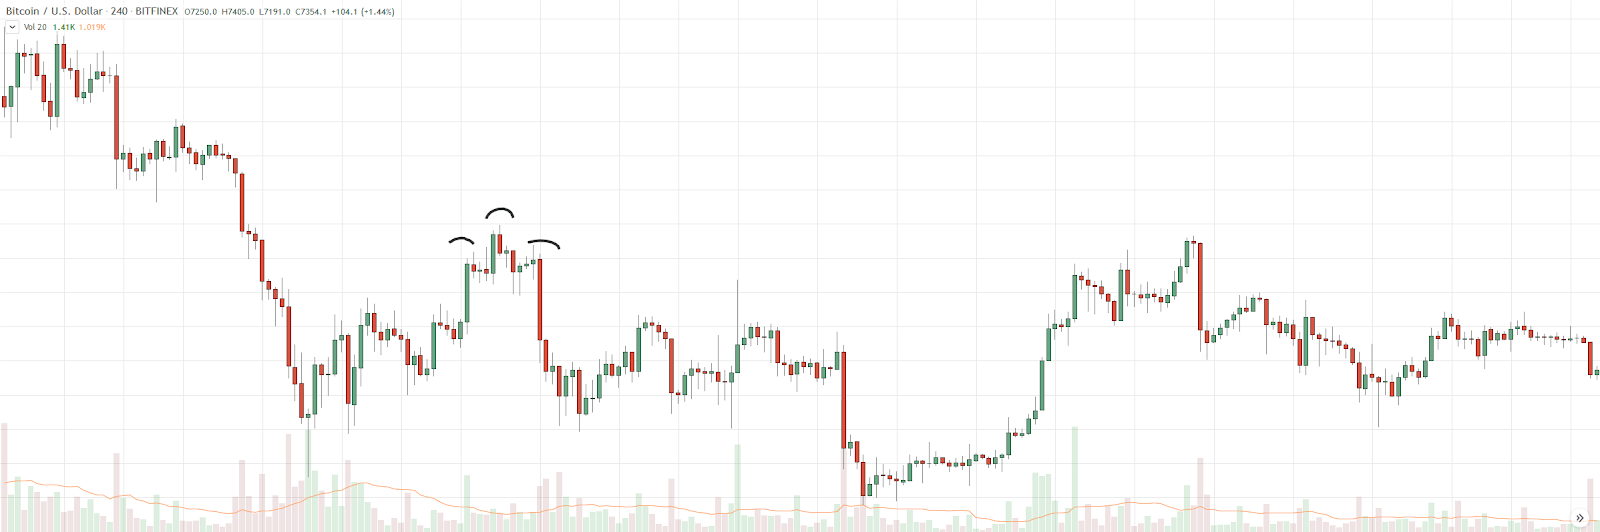
Bullish divergence

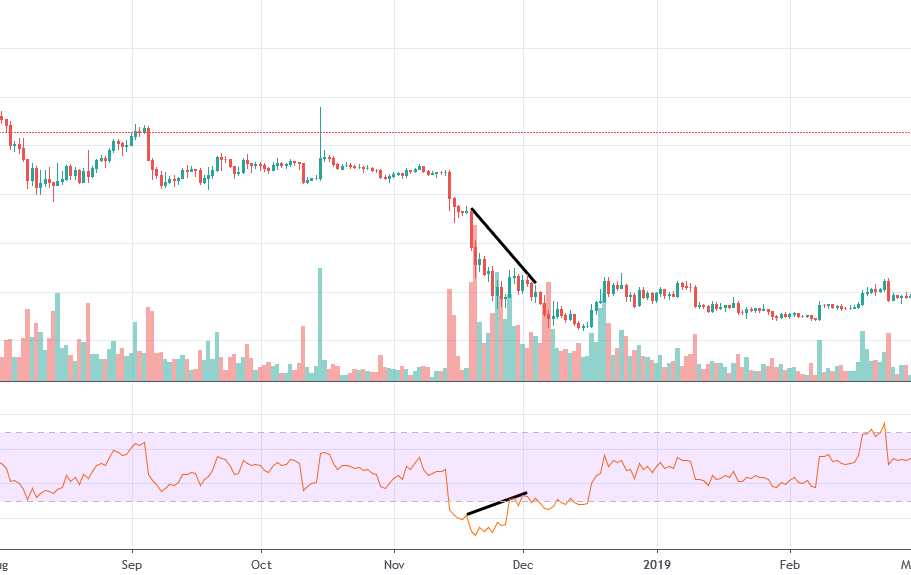
A bullish divergence appears when lower lows are set on the price chart, and higher lows are set on the oscillator — in this case, the Relative Strength Index. As you can see in the chart above, there was a rapid increase in price shortly after the identified bullish divergence played out. However, take note that while there was a momentary spike in price, the overall downtrend remained intact.
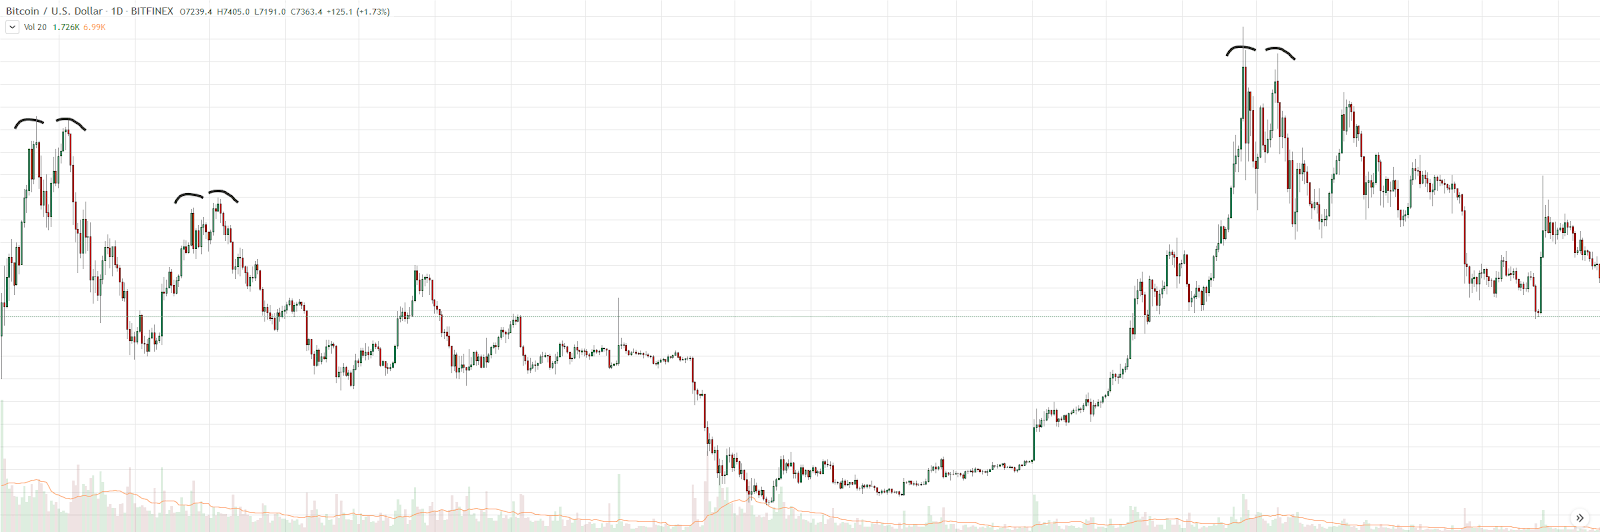
Bearish divergence

A bearish divergence appears when higher highs are set on the price chart, and lower highs are set on the oscillator. As you can see in the chart above, there was a rapid decrease in price shortly after the identified bearish divergence played out. However, take note that while there was a decrease in price, the overall uptrend remained intact.
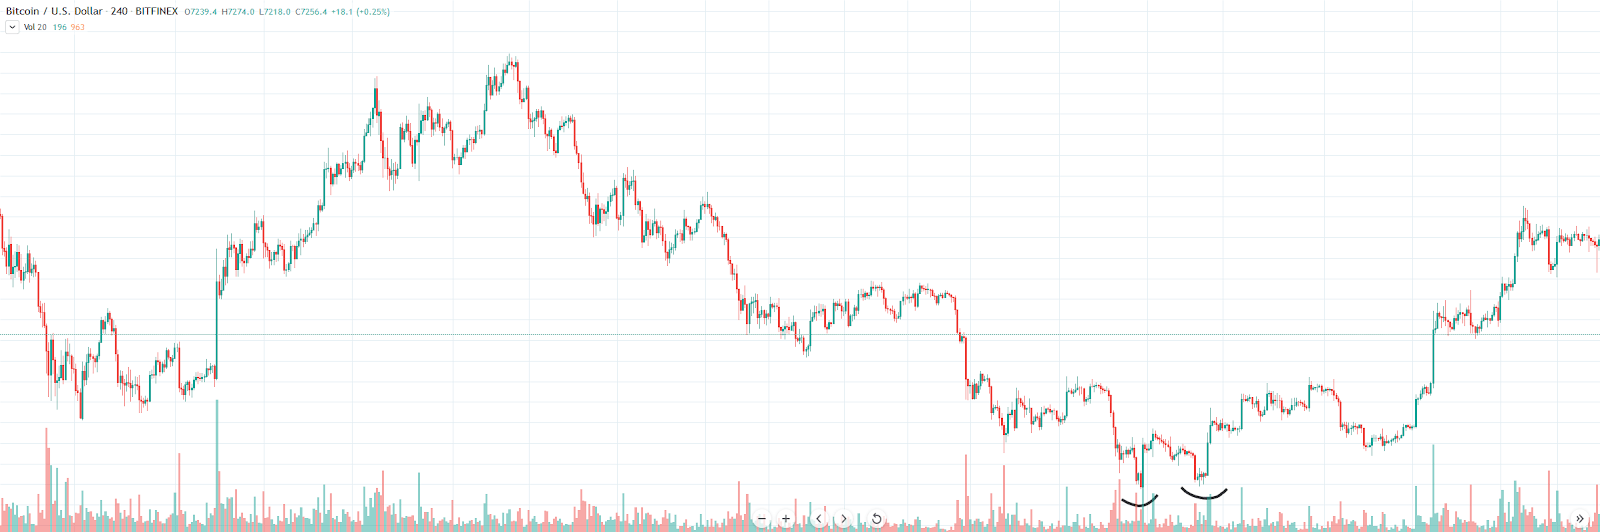
Hidden bullish divergence

A hidden bullish divergence appears when higher lows are set on the price chart, and lower lows are set on the oscillator. As you can see in the chart above, the price continued on its upward trajectory immediately after the identified hidden bullish divergence.
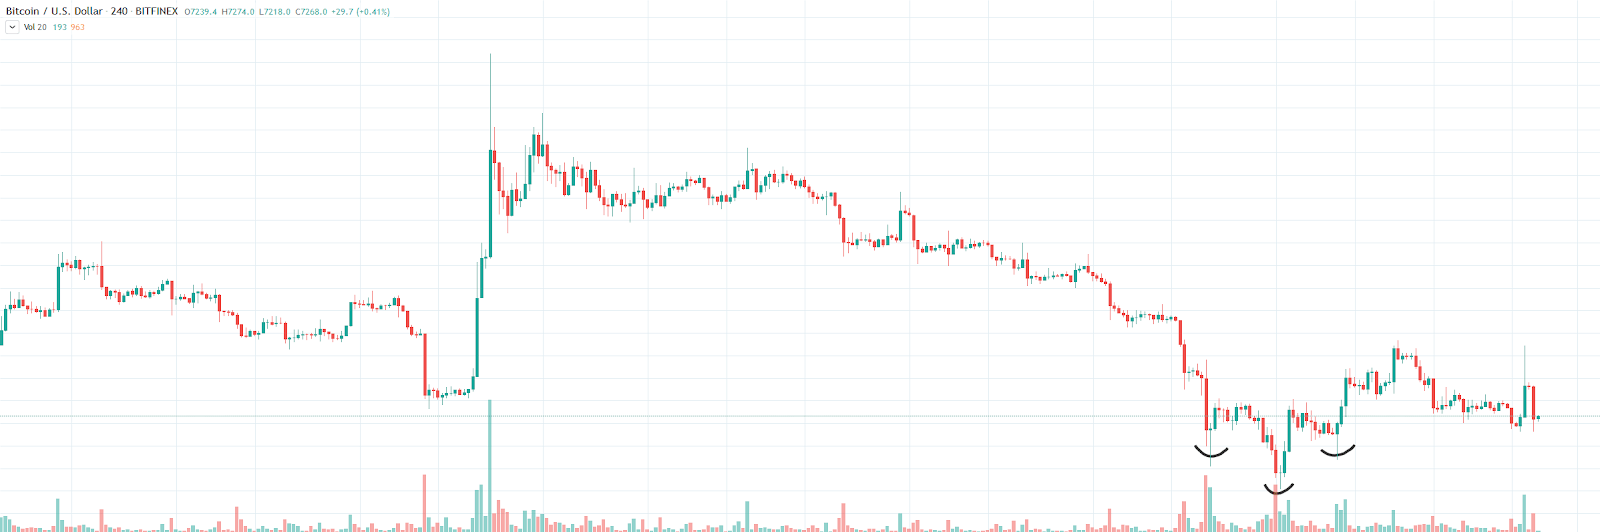
Hidden bearish divergence

A hidden bearish divergence appears when lower highs are set on the price chart, and higher highs are set on the oscillator. As you can see in the chart above, the price continued on its downward trajectory immediately after the identified hidden bearish divergence.
Conclusion
Both fundamental and technical analysis have advantages and disadvantages. While both approaches have lots of supporters, there are also people who don’t think either of these analytical methods are effective. Supporters of the Efficient Market Hypothesis believe that it is nearly impossible to use fundamental or technical analysis to reliably beat the market.
Fundamental analysts will tell you that if the project is good, the price will eventually reflect that. Technical analysts will tell you that there are tools to help you make informed trading decisions. Efficient market hypothesis advocates will tell you that FA and TA are both worthless.
In the end, traders and investors will take the approach that they feel works best for them.
You've got mail!
Sign up to our newsletter to keep up to date with everything Oxen.